
Tables – Desktop vs Mobile
Tables are widely used in the applications I worked on to display structured data such as reports, listings, and invoice. While they are clear on desktop, mobile devices present challenges due to limited screen space. Through usability feedback, I found that a single pattern does not work for every case. Instead, each type of table required a tailored approach — side scrolling for reports, card layouts for listings, and simplified columns for invoices — to balance readability, comparison, and usability.
Decision & Rationale
1) Tables (Desktop)
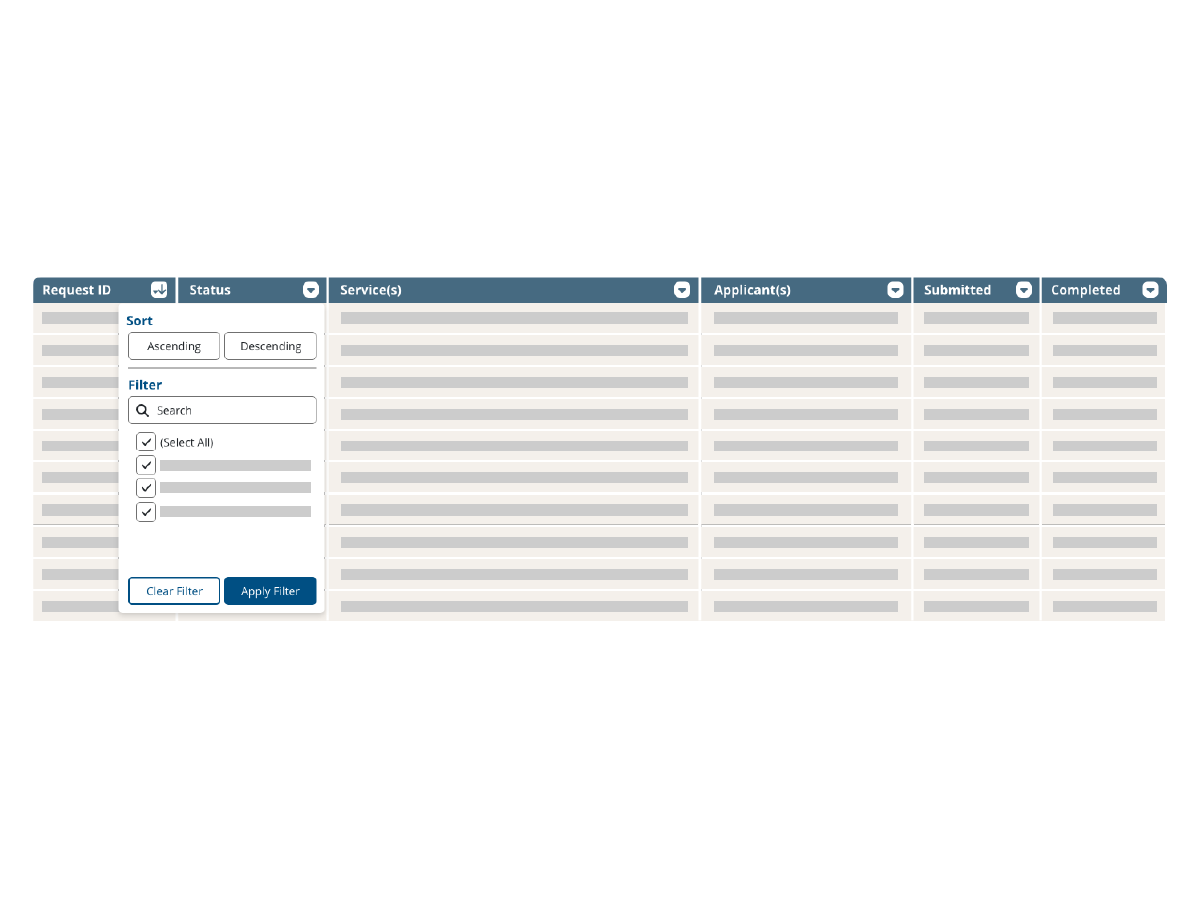
Retained the standard row-and-column layout with clear headers and consistent spacing to maintain a familiar format for data-heavy tasks. For complex datasets, I included sorting and filtering functions on each column, similar to Excel, enabling users to manage and analyze information more effectively.
2) Tables (Mobile) – Listings
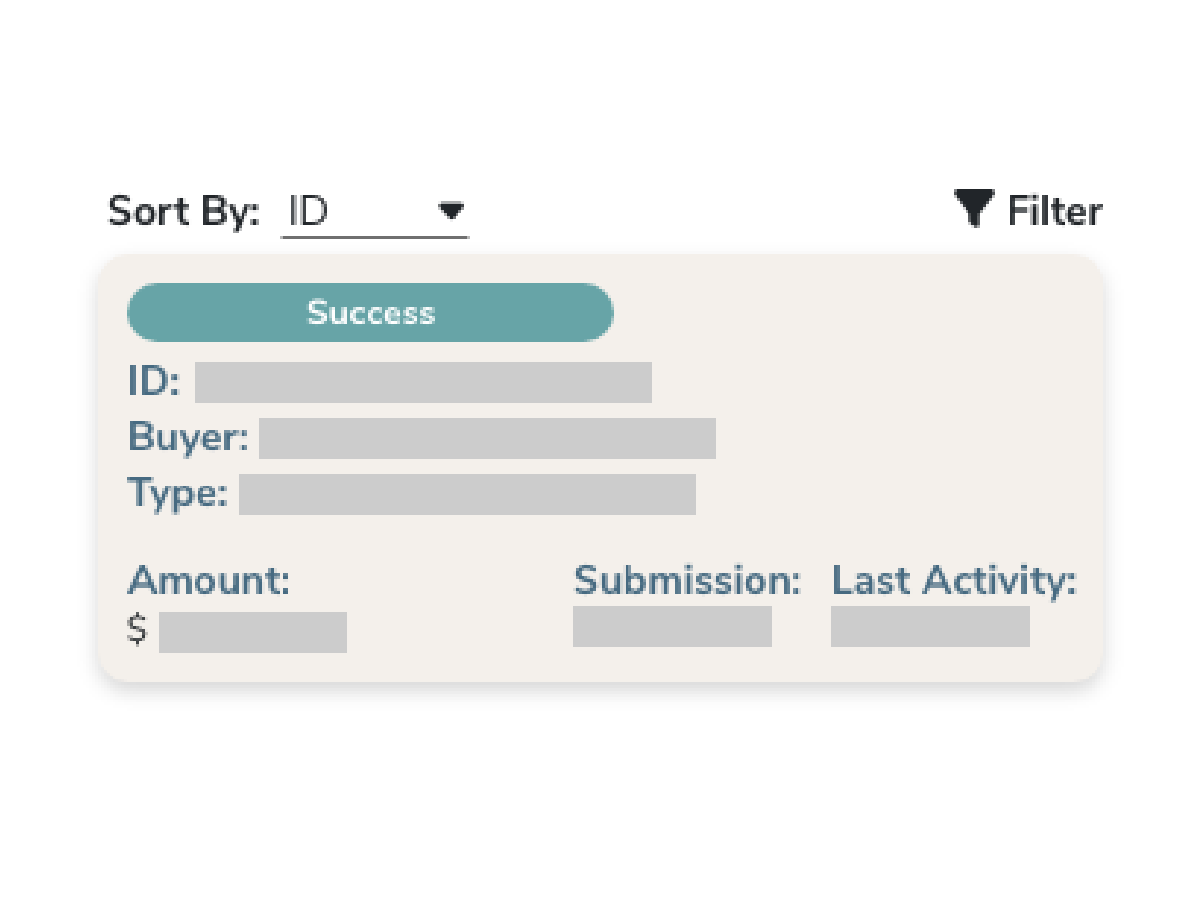
For product listings and similar data, stacked card layouts worked better. Cards emphasized the most important fields (e.g., product name, status) and reduced clutter, making scanning more efficient.
3) Tables (Mobile) – Invoice
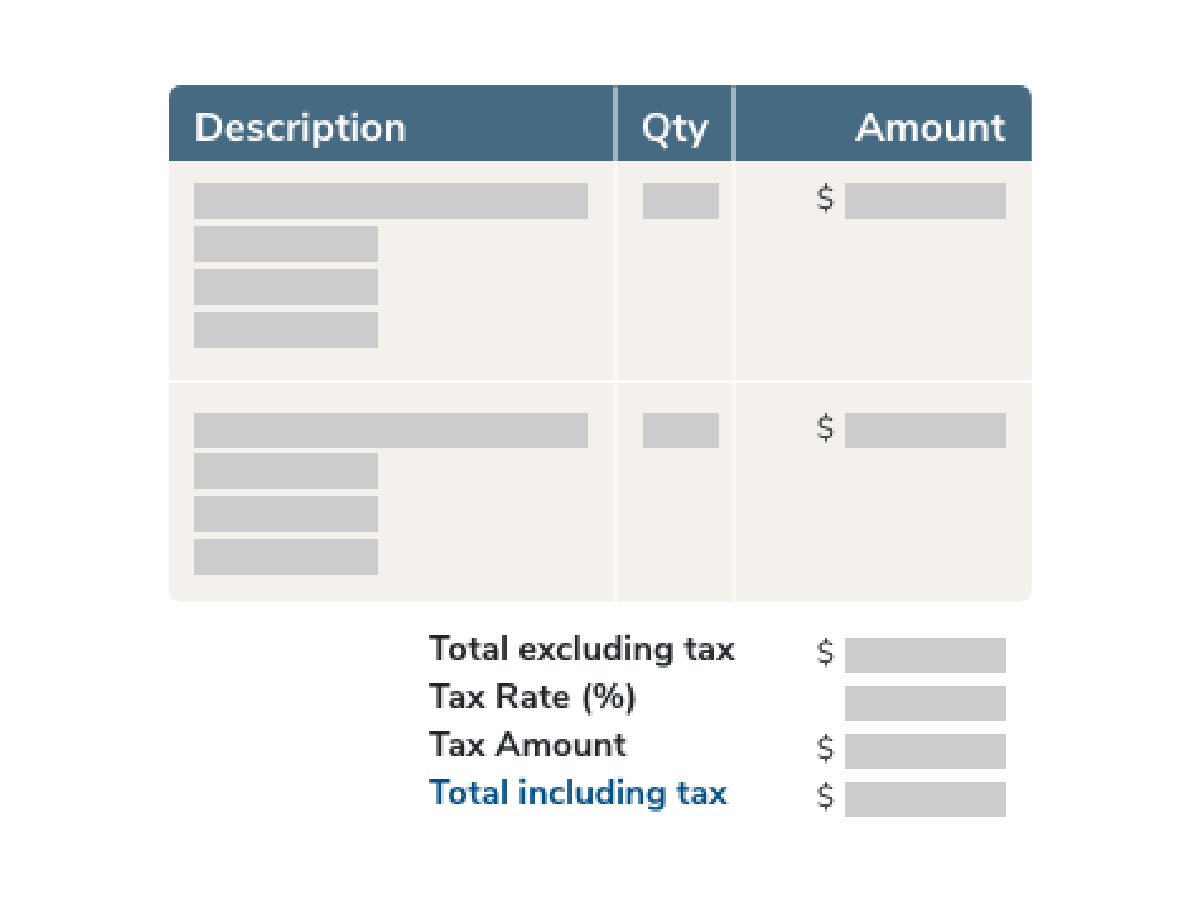
To simplify dense invoice tables on mobile, I combined certain secondary columns while keeping critical fields, such as Quantity and Subtotal, visible at all times. This ensured financial data remained accurate and accessible without overwhelming users.
4) Tables (Mobile) – Reports
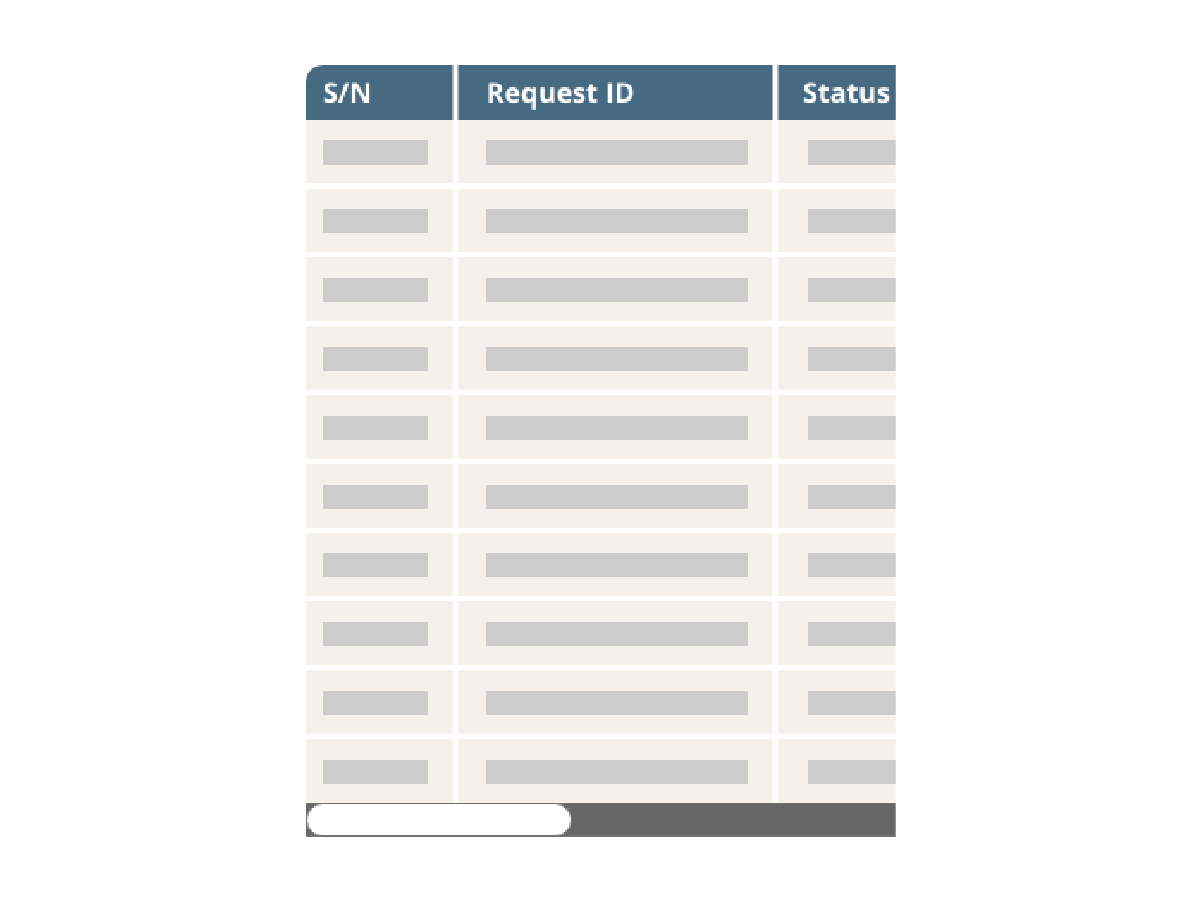
For reports on mobile, users preferred side-scrolling tables over card views, as side scrolling made it easier to compare values across multiple columns without expanding or collapsing sections.
Takeaway
Effective table design is not about applying a single responsive pattern, but about adapting to context. By using side scrolling for reports, card layouts for listings, and simplified columns for invoices, I ensured that users could always access and act on the most important information. This flexible approach improved readability and efficiency across different applications and devices.